


Burning UP!
How to read & spot a BULLISH reversal using candlesticks

Summary
Candlesticks are best used in tandem with fundamentals
To be a bullish reversal there should be an existing downtrend, otherwise it’s a continuation candle
Candlestick patterns need bullish confirmation. Without, they are neutral patterns or indicative of support/resistance
Look for new buyers to continue buying pressure. IE: A Gap up, Long green candles or an advance of volume.
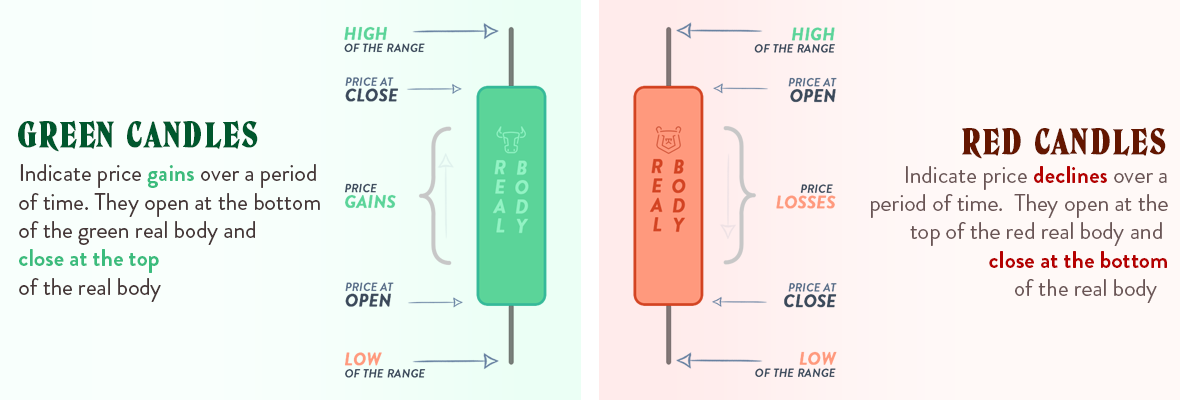
Candlesticks, and stock movements in general, work similarly to business, governed supply and demand. The more people looking to sell the lower the price sellers are willing to take in order to make the sale. Inversely, the more people that want to buy, the higher the price they are willing to pay. When you sell, someone buys. When you buy, someone sells. This trading of shares from one person to another is called volume. Volume is important when looking for uptrends or reversals because it shows the level of interest in buying, and continued buying. Price movements on low volume show indecision or hesitation in the move, so we want to see volume increase to support the movement.
Now that we know how candlesticks work, and why volume is important, let’s get into some patterns.
Hammer & Inverted Hammer
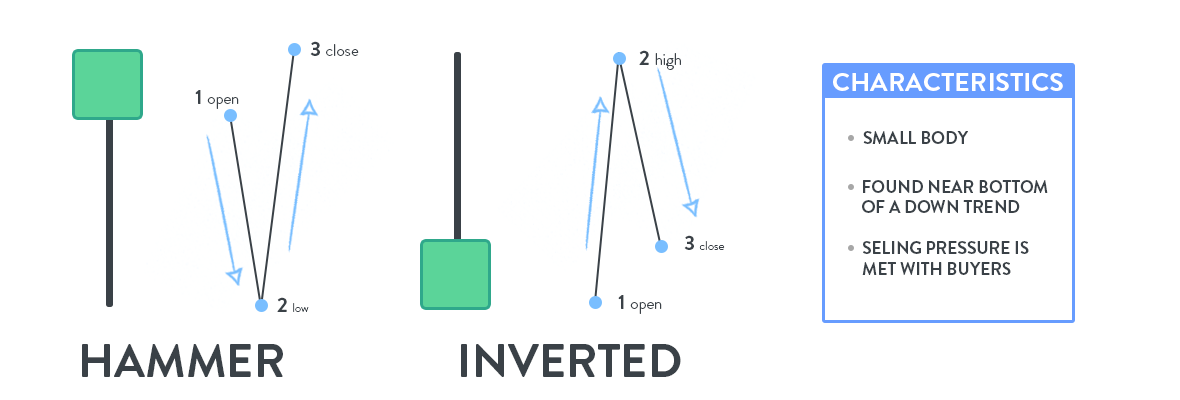
The Hammer candlestick is a small body candle that opens (1) with downwards pressure from sellers (2), before rallying to a new intraday high (3). The Hammer gets its name from its shape which is similar to a lollipop.
The inverted hammer is the exact same but flipped onto its head. The price opens low (1), then proceeds to rally (2), before selling pressure pushes prices down (3). Closing near but above the original open.
If you see one of these two candles form in a downtrend, wait for a trend reversal that can be validated by a gap up, large green candle, or an advance in volume.
Bullish Engulfing
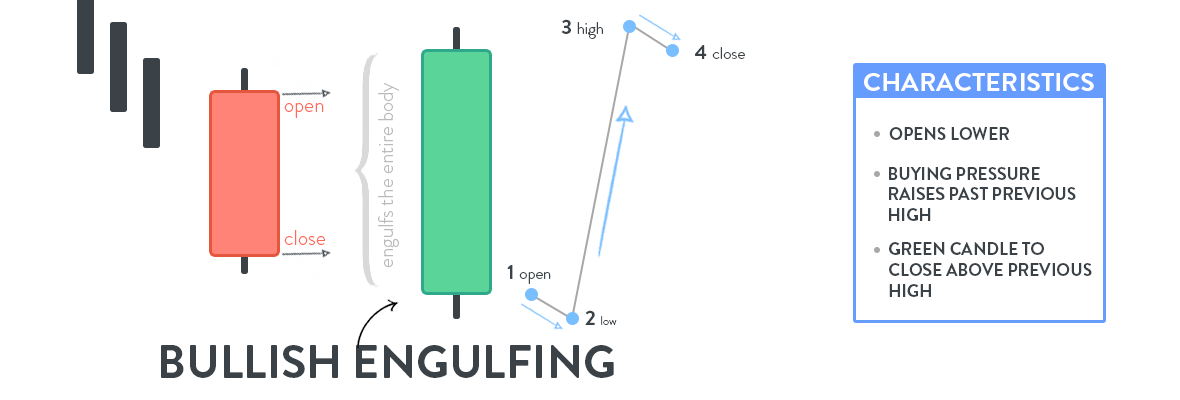
Bullish engulfing candles gap down following a red day in a downtrend (1). Notice how the open is lower than the first candles close. After open (1) you may see continued selling (2) before reversing to new intraday highs (3). Finally, they close above the real body of the previous day (4).
It’s typical for the closing of the 2nd candle (4) to be at or near intraday highs (3), signaling that bulls are in full control at the close, with a high likelihood of continued buying pressure in the following session.
The engulfing candle does not require the entire range of the red candle to be engulfed. Instead, just the open and close (real body) of the previous candle. This requires the second candle to gap down in order to ‘engulf’ the closing price of the first candle.
If using this as an entry indicator, longs will look to enter when prices rise above the previous day’s high.
The bullish engulfing patterns show a reversal in sentiment, with buyers turning the tables on sellers. This pattern forms after a continued downtrend as bulls take the driver’s seat away from bears.
The Piercing Line
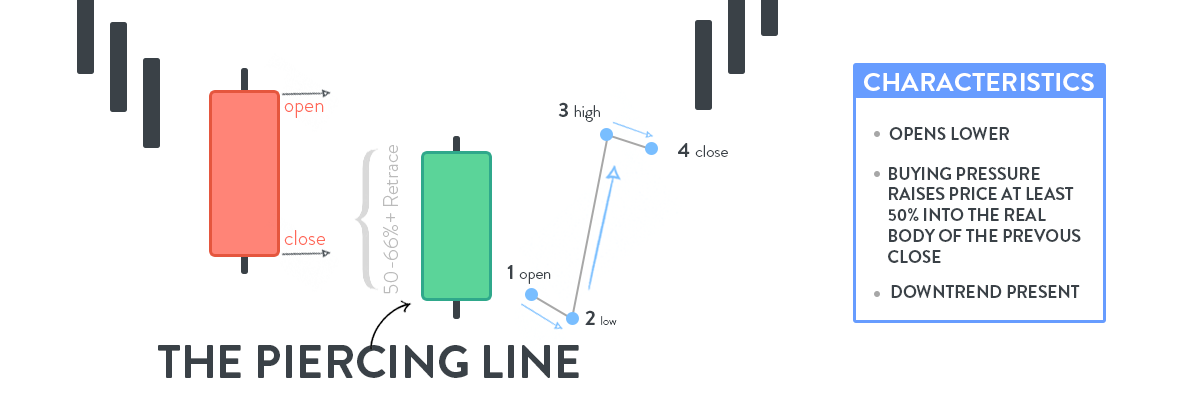
The piercing line is very similar to the engulfing candlestick above. The price opens below the previous close (1) with a downtrend intact. Otherwise, it’s not an indicator of a reversal.
The second candle will bounce after a gap down, which often signifies newfound support. These new low prices are cheap enough to attract enough buyers to overpower sellers. Prices must retrace at least 50% of the first candles’ real body to classify as a piercing line.
The general rule of thumb: the longer the downtrend preceding the piercing line, the greater the performance of a reversal.
The Piercing Line is a signal for reversal, look to confirm this pattern over the following sessions. A breakaway gap up following a piercing line is considered to be a very strong confirmation of the reversal.
Three White Soldiers

Typically occurs at the bottom of a downtrend. This pattern consists of three consecutive green candles, each opening higher than the previous candle, and finishing at or near highs of the session. Each of the candles opens inside the real body of the previous candle, with no gap ups between them.
Finishing at or near highs is indicative of the buyers being in control, with continued upward momentum at the close. We look for this momentum to continue into the next couple sessions in order to see the Three White Soldiers pattern form.
Three White Soldiers can sometimes bring risk. If the three candles are sufficiently large, they can be a target for sellers, who believe the buyers may have gotten ahead of themselves. Too fast too soon.
If this pattern happens outside of a downtrend it loses much of its bullishness, you also want to see volume pick up with the move. It’s important to be aware of where the next level of ‘support’ is located. Ideally, this pattern pushes you past a level of resistance, which now becomes a level of support or a ‘floor’ for prices in the short term.
The Morning Star

The morning star is a sign of hope or a new beginning. This is a three-candle pattern that occurs during a downtrend. One large red candle, a small red OR green candle with a small body and long wicks, followed by a large green candle. The Morning Star is the 2nd candle in the pattern.
The Morning Star showcases the indecision between buyers and sellers, where sellers begin to succumb to buyers. The third candle being a long green candle is confirmation of buyers regaining control and can mark the beginning of a new uptrend.
The morning star likes to see volume increasing in each subsequent day of the pattern formation. With the ‘morning star’ seeing heavier volume than the initial red candle, followed by the heaviest volume on the last green candle. Signaling that buyers are back firmly in the driver’s seat.
In terms of the price action above, the morning star opens with a gap down (1), then proceeds to bounce up and down, for the duration of the session as buyers and sellers fight until finally settling near the original open (1). Look for a gap up and continued buying pressure on the third candle.
The Morning Star only occurs when all three of the candles in the pattern form. Buyers need to step up to the plate and challenge sellers otherwise the downtrend will resume. An increase of volume with little to no price action shows that everything sellers are dumping is being bought. This buying pressure is absent most of the time during a downtrend, so when it arrives buyers need to buck up and hold their ground. Sellers will typically fight to maintain their control which is how long wicks form on the candle.
Although technical analysis is widely used to predict price movement in markets, they are far from perfect and do not guarantee a reversal. Investors must look for confirmation of the reversal before entering a trade.

Each of these candles presents the opportunity for a bullish reversal, where selling pressure is exhausted and buyers overtake the sellers. To be a bullish reversal there must be something to reverse (i.e. a downtrend) and any new buyers looking to enter should look for confirmation of a reversal before entering the trade. If there is no confirmation of a reversal these patterns become neutral and behave as a potential indication of found support or resistance.
As I mentioned earlier, its best to use these patterns in tandem with fundamentals. Often times it’s fundamental ‘lines in the sand’ that determine where buyers decide to step in, or not.
Need to brush up on your fundamentals? check out these articles
If you found this article useful at all, please support this page by dropping a follow & leaving a like and a comment!
You can support & give back by signing up for the newsletter and sharing this article with a friend. Have an idea for a future article? Let me know down below.
I appreciate you all. Until next time,
Ryan, SDW Investing

Very helpful!