


The P/E Ratio
The most commonly misunderstood ratio.

The P/E ratio represents the relationship between the current fair market value of a stock, which is the ever-changing price you see throughout the days, weeks & months. And its earnings per share (EPS) usually TTM. In the most boiled down, simple explanation possible;
P/E is your cost , to buy $1 of profit in a company today.
It seems easy enough! but what exactly does that mean? To properly demonstrate let me use Google as an example:
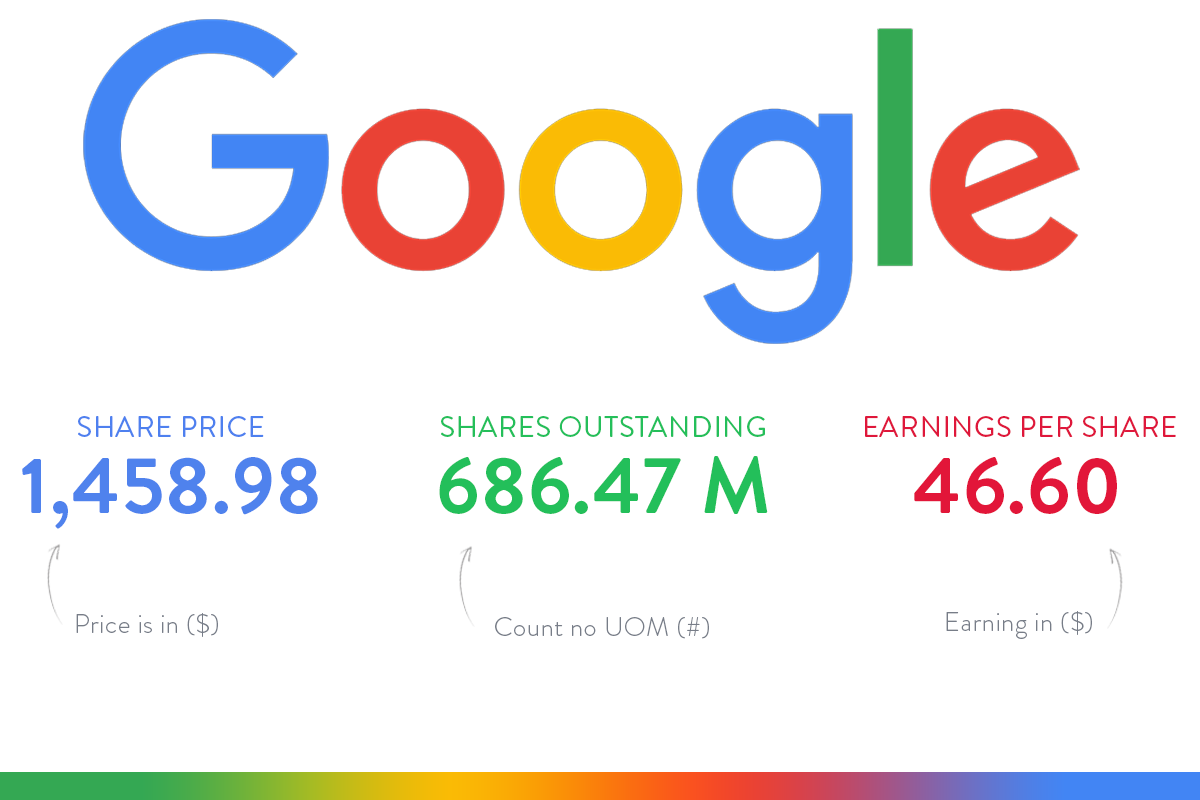
At the time of writing this (June 9th, 2020) Google’s share price was a whopping $1,458.98, which is pricey indeed. We can also see that Google has earnings per share (EPS) of $46.60.
From here we can deduce the following:
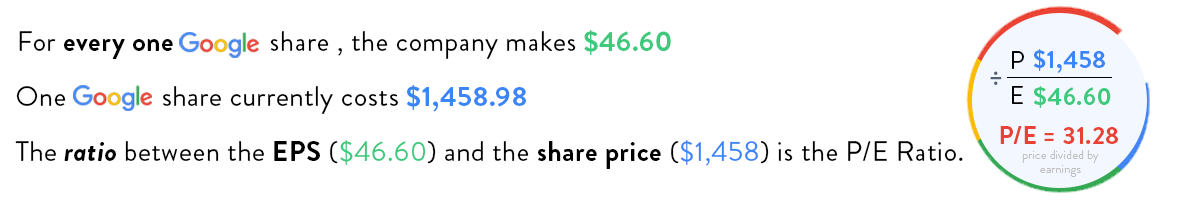
Comparing the share price-to-earnings tells us how many more times expensive the stock is relative to the income it produces. When you divide these two numbers, the denominator (earnings) gets reduced to the lowest possible factor of 1.00. From there based off our logic we can comfortably say that;
P/E of 31.28 means you spend $31.28 for every $1.00 of profit
This may seem crazy and expensive but investors pay up for future returns. We invest in cash we expect to be generated NOT for the cash currently being generated.
If you expect Google to earn $46.60/share every year into the future, or less than that in subsequent years you will not want to pay a premium. In fact, you want a discount or to avoid it altogether.
If you expect Google to return more than $46.60 next year, which we should & If that trend is expected to continue into the future, you as the investor may be willing to pay more now, in order to gain more later.
Keep in mind, a high P/E might stay high for years. P/E alone is not a good indicator of overbought or oversold. Google is the perfect example.

Determining what P/E ratio is appropriate for a particular stock is a little more difficult than simply finding it. A high P/E isn't always bad, and a low P/E isn’t always good. Some factors that affect what P/E a particular stock can support are (but not limited to); earnings growth, margins, ROE & ROIC, Macro outlook, Cycle stage, debt, moat & sector P/E averages… among others! and I will cover these in future posts.
I appreciate anyone who made it to the end of my first blog/newsletter. I am looking forward to using this as an outlet to you all beyond social media and will use this as a place to post more in-depth learning, my watchlists, and perhaps even my stock purchases.
Until then,

Amazing content as always! <3
This is brilliant! Keep them up👌😁😁